A New and Improved Webhook Section
We're kicking off this week by introducing a brand new Webhooks section in the Pipe account area. This section will make it a lot easier to understand, test and debug your webhook integrations with Pipe.
Webhooks are the recommended way to integrate with Pipe because they're easy to implement, you get a lot of data, they're real-time and they work when the user loses Internet connection or closes the browser. You can trigger a lot of stuff server-side based on these webhooks being fired. Given their importance it was only a matter of time until we gave our Webhook section a well-deserved refresh.
Here's what's new:
1) A new Schedule section
This section shows you the list of events for which we've fired the data towards your webhook URL/script together with the request headers and body that were sent towards your URL/script and a bunch of other information.
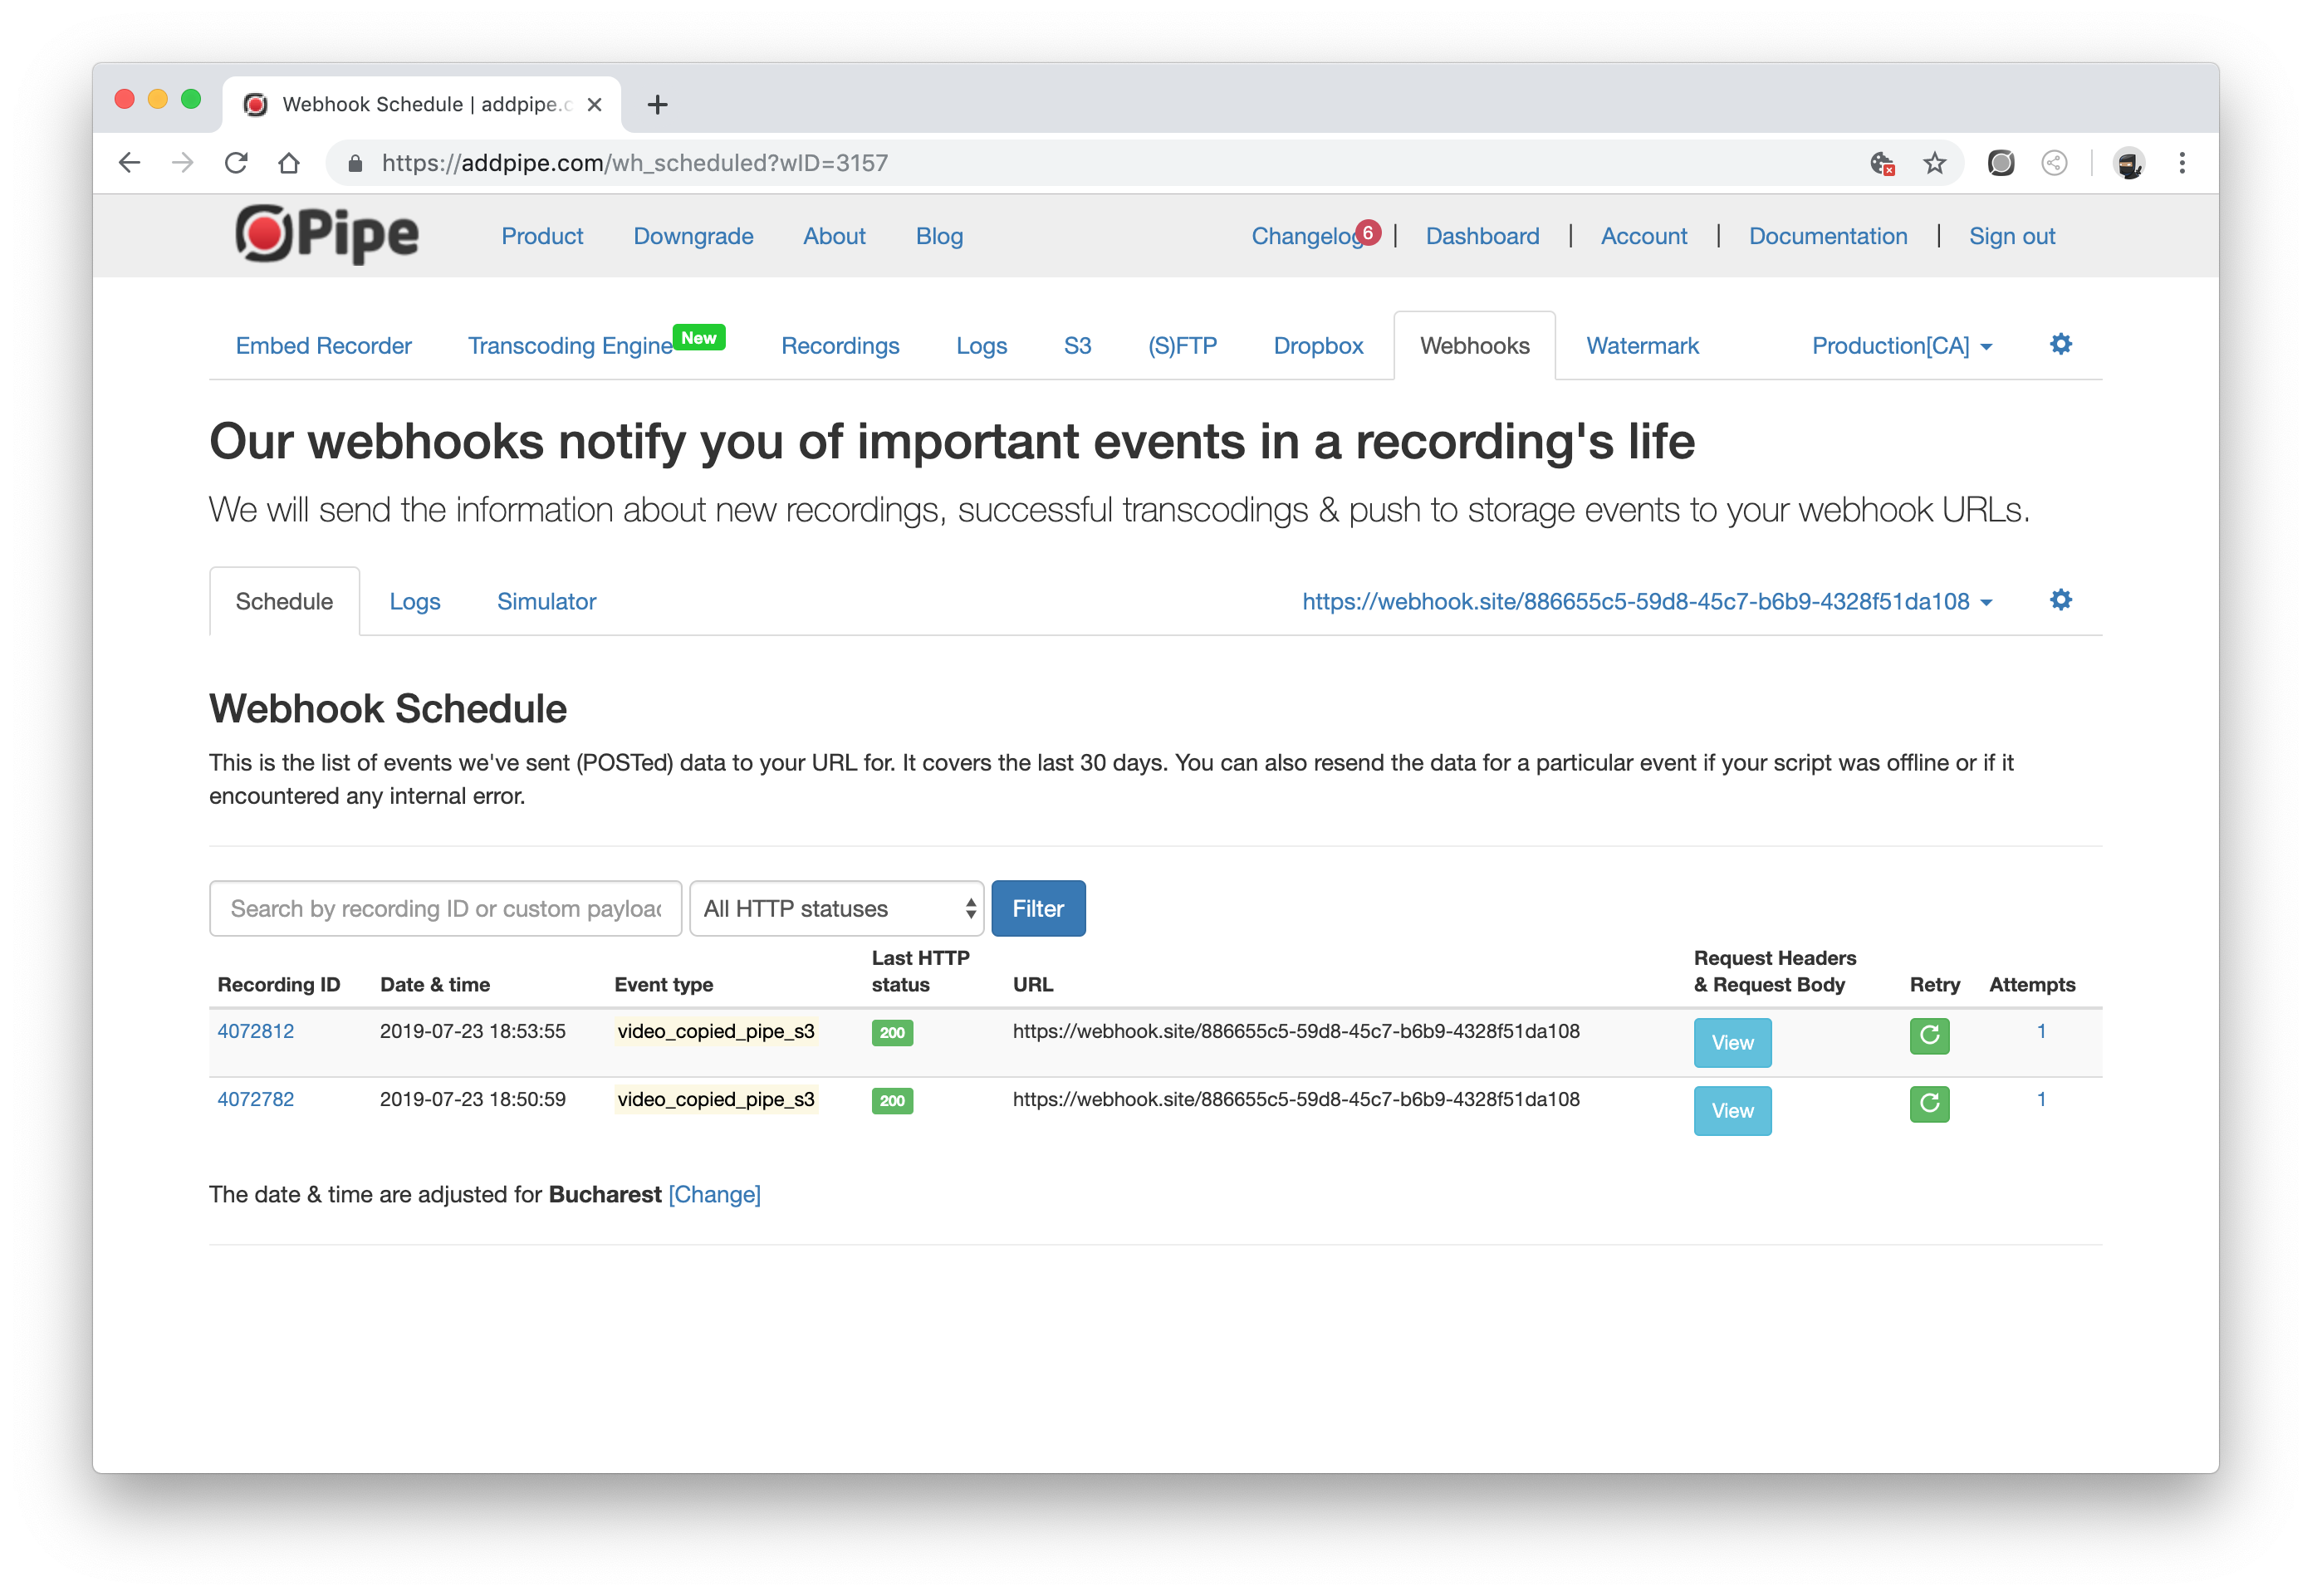
This information was not previously available through the Pipe account area.
2) Resend webhooks
From the above-mentioned Schedule section, you can resend the data for each event. This is very useful when:
- developing the code that receives the webhook data
- your site goes offline for some time and you need to receive the data once the site is online again
- your code runs into an error and you need to re-send the data
Similar functionality was previously available in the Recordings list but we've moved it here for much more clarity when using more than one webhook.
The new Schedule section will also show you how many times each webhook event was fired.
3) New logs section with extended access to logs
Previously, the account area was showing only the latest 100 attempts to push data to your webhook URL. For our biggest clients, this means only a few minutes worth of webhook firings. When encountering problems, the client had to wait for our tech support to provide the data manually.
We're now showing the last 30 days worth of events (and the associated logs) for PRO accounts and the last 72 hours for Standard accounts. This is in line with the data policies on other logs like those from attempts to push files to the client's storage.
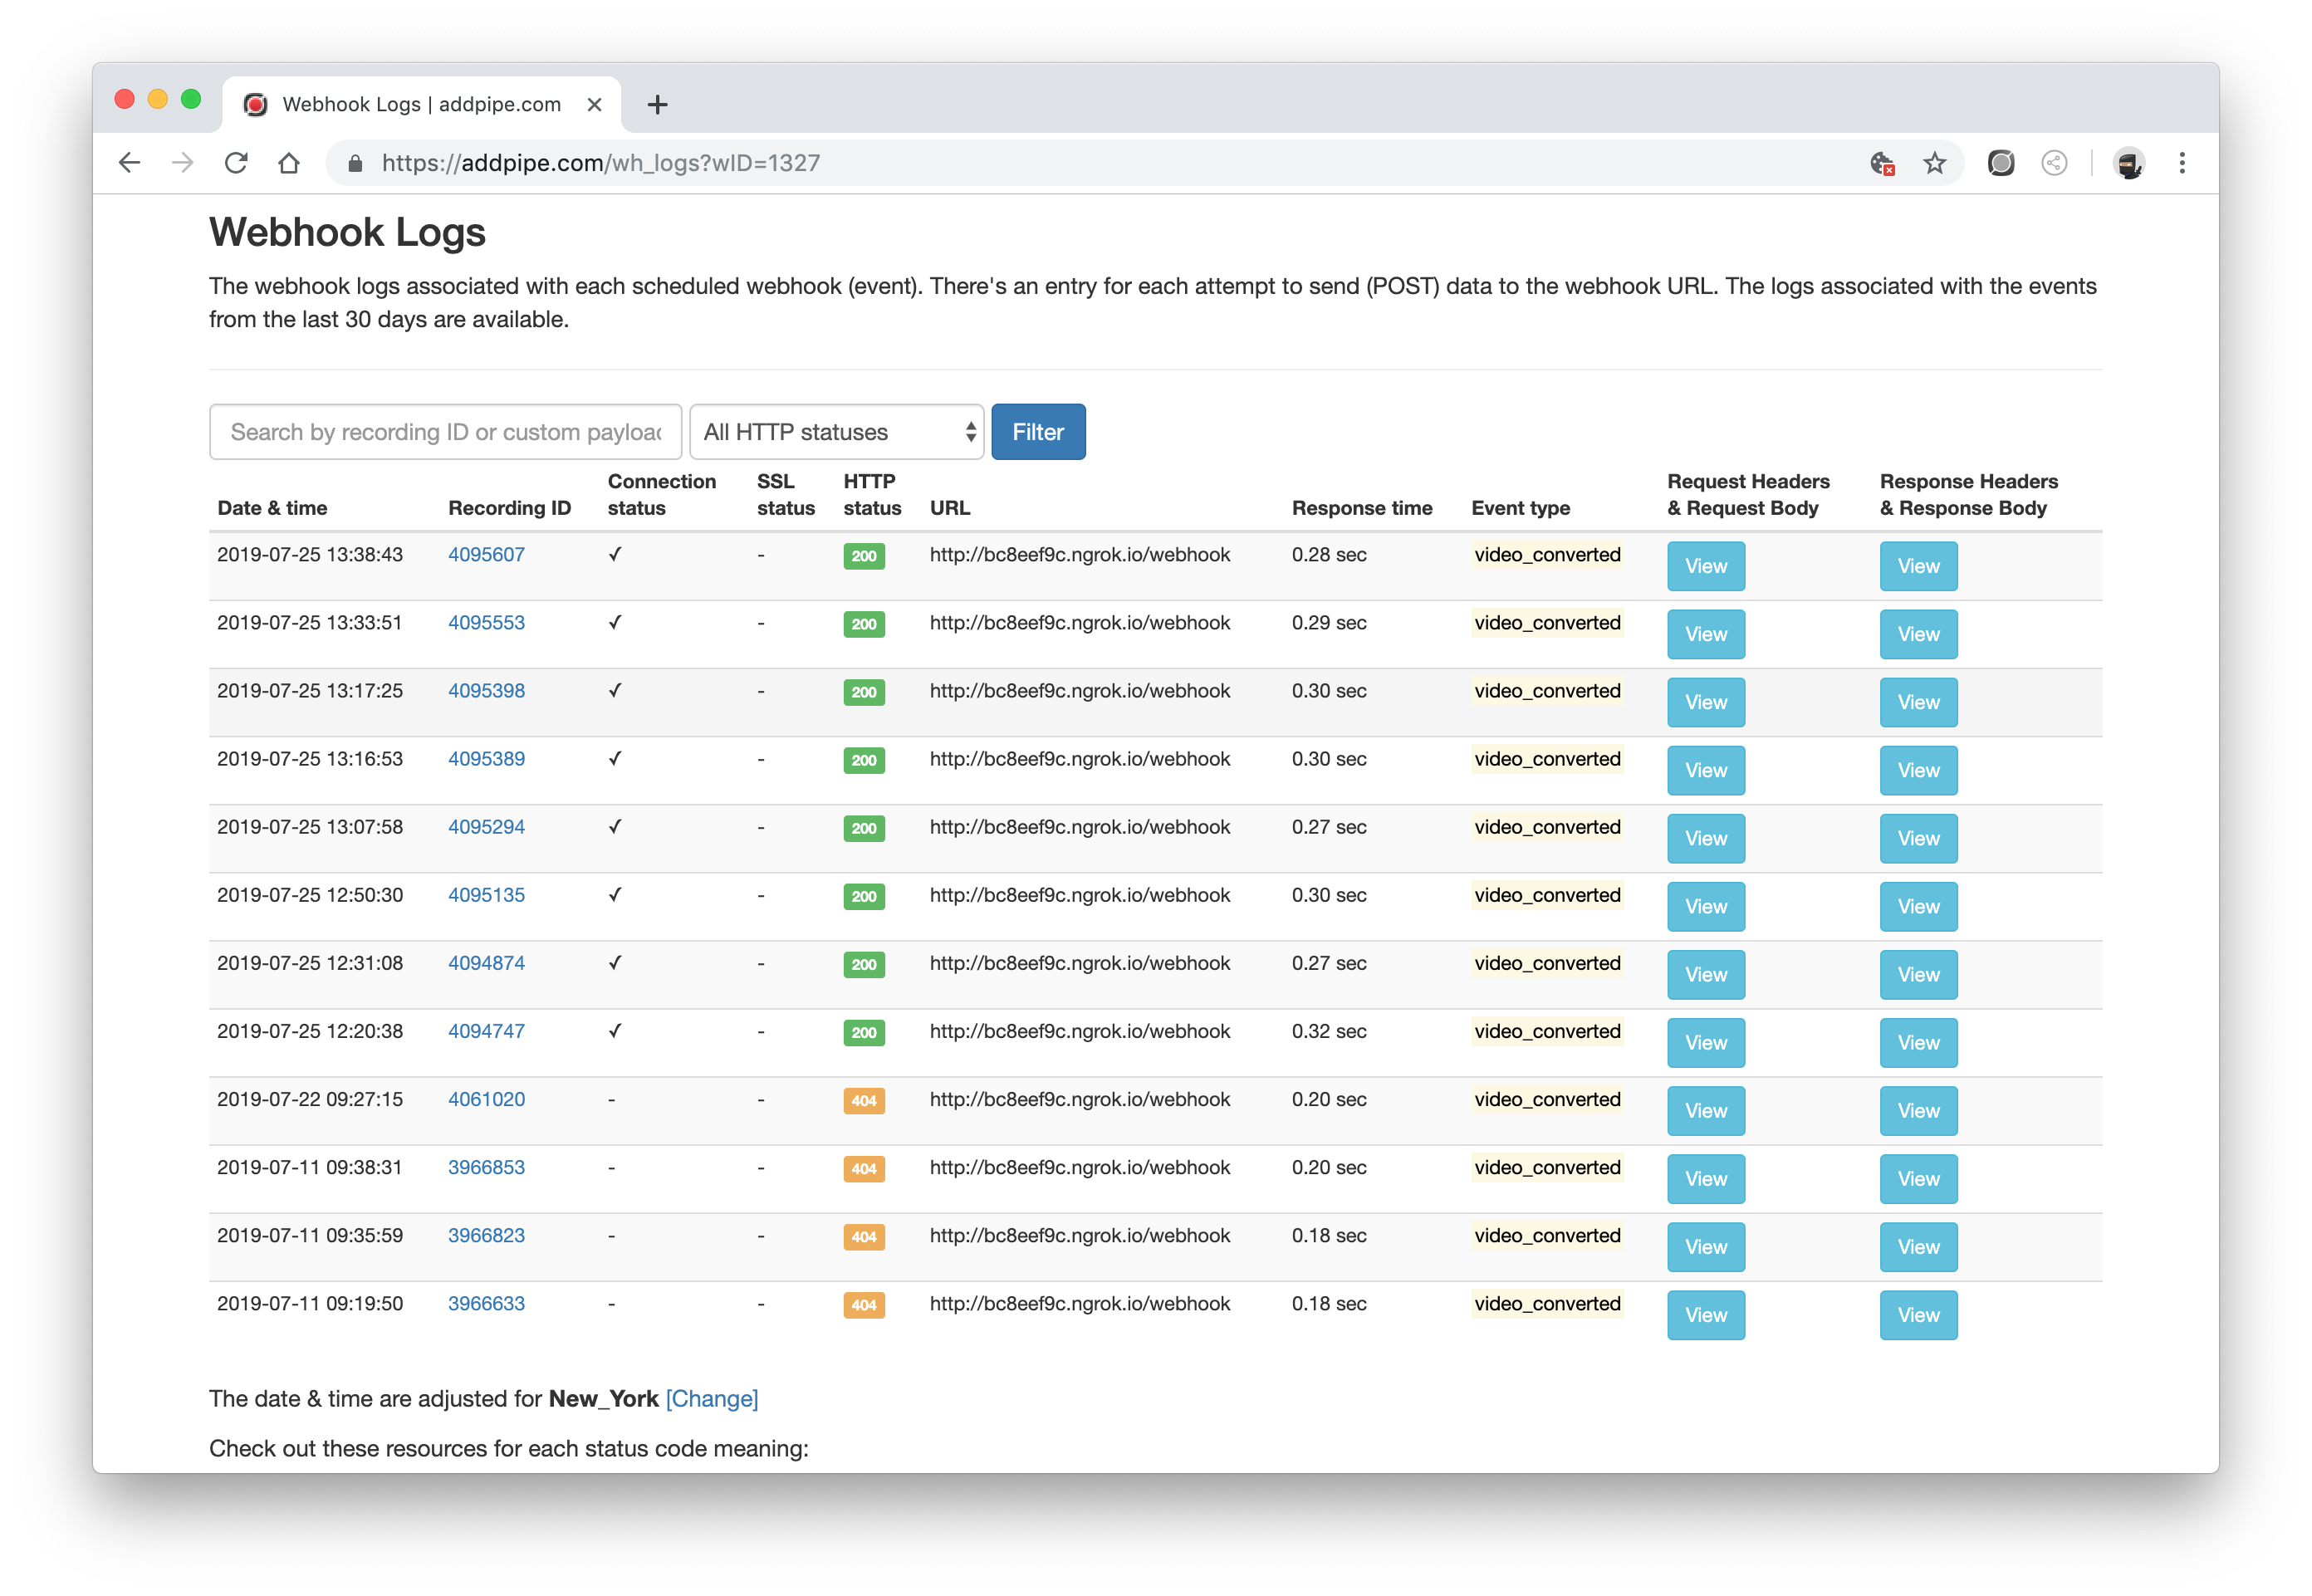
4) Better status information
The status info about each attempt to POST information to you now covers a lot more ground. The account area now also shows
- the connection status (useful in case the host is unreachable and many other cases)
- and the the SSL status (very useful for https webhooks when there's a problem with the certificates)
on top of the already present HTTP web server response (once a connection has been established and a SSL handshake has been completed, we can send the data and receive a response from the web server hosting the webhook code).
5) Pagination, Filters & Search
Since we're now showing so much more data, we've added:
- search by recording ID and custom data
- filter by HTTP status (200 and other)
- pagination
to the Webhook Schedule and Logs sections.
These 3 tools will make it easy to find webhook events and logs for a specific recording or filter out those logs where your webhook data receiving code ran into problems and returned a 500 Internal Server Error HTTP status instead of 200 OK.
6) Turn webhooks OFF and ON
You can now deactivate a webhook without deleting it. There's a new Active toggle when adding or editing webhooks.
7) More sample data for testing your webhooks
We've updated the sample data in the Simulator section with:
- up to date JSON data which contains all possible data including the fields that are added when the transcoding engine is fully activated
- sample data for audio recordings
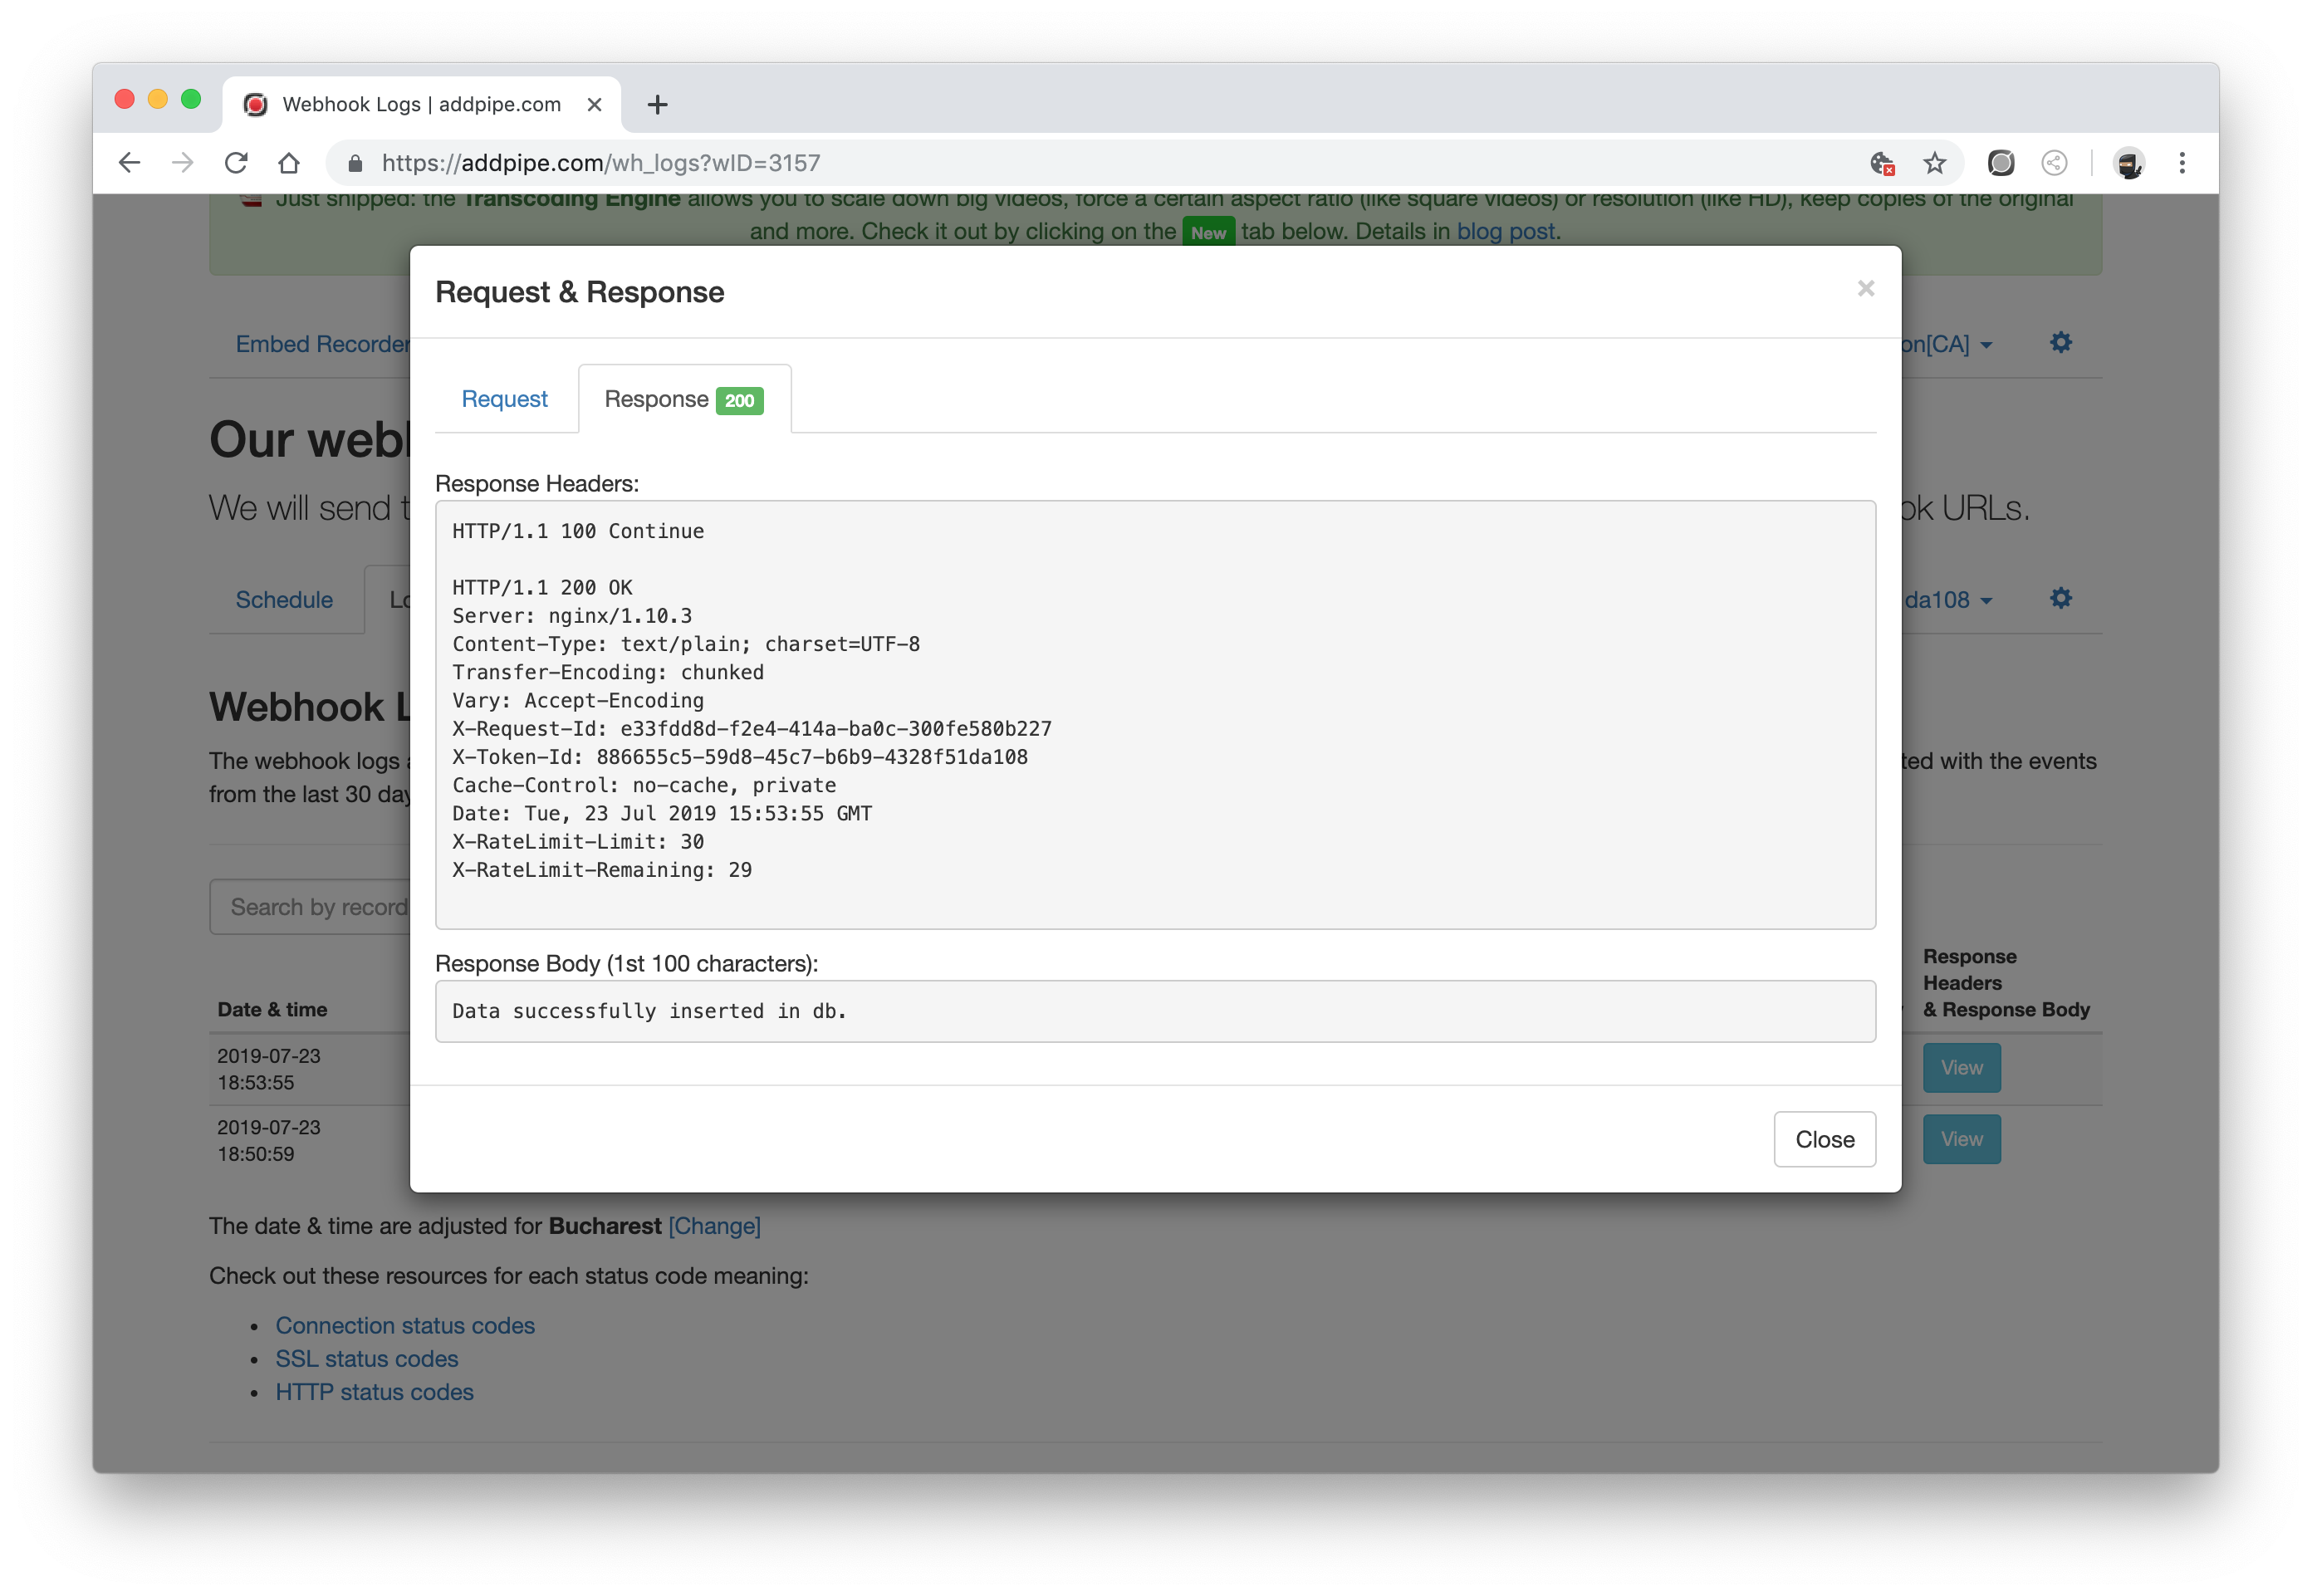
8) Better UI for investigating request & response headers and bodies
We've now separated the request & response headers and bodies into 2 separate tabs with 2 fields each.
9) Webhook response time
We'll now show the response time for each webhook firing in the Logs section in milliseconds. You'll be able to identify slow responding webhook code on your side.
10) Quickly switch between webhooks with the drop-down menu
This new dropdown will make it easy to switch between webhooks when you have 2 or more defined.